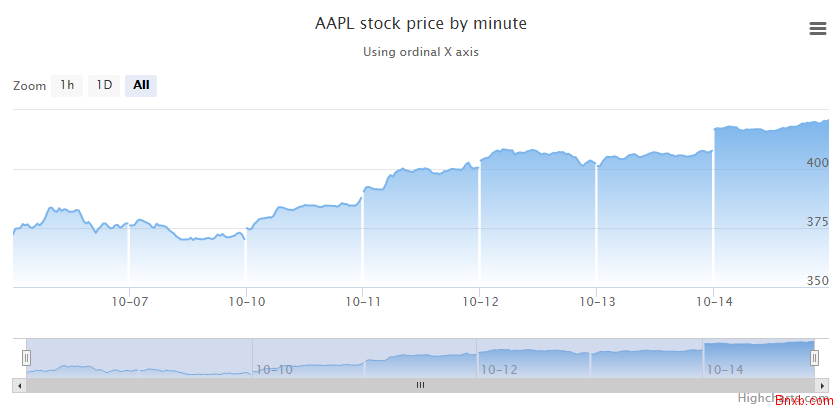
HighCharts日期格式设定 英文月日改中文日期
HighCharts是目前用的较多的一个图表JS插件,很多人不知道怎么设置日期格式,其实很简单
看下面一段参考代码:
$(function () {
$.getJSON('https://www.bnxb.com/jsonp?filename=json/new-intraday.json&callback=?', function (data) {
// create the chart
$('#container').highcharts('StockChart', {
title: {
text: 'AAPL stock price by minute'
},
subtitle: {
text: 'Using ordinal X axis'
},
tooltip: {
split: false,
dateTimeLabelFormats: {
millisecond: '%H:%M:%S.%L',
second: '%H:%M:%S',
minute: '%H:%M',
hour: '%H:%M',
day: '%m-%d',
year: '%Y-%m-%d',
},
headerFormat: '{point.x:%Y-%m-%d %H:%M:%S}<br>'
},
xAxis: {
gapGridLineWidth: 0,
dateTimeLabelFormats: {
millisecond: '%H:%M:%S.%L',
second: '%H:%M:%S',
minute: '%H:%M',
hour: '%H:%M',
day: '%m-%d',
},
crosshair: {
label: {
format: '%Y-%m-%d'
}
}
},
navigator: {
xAxis: {
dateTimeLabelFormats: {
millisecond: '%H:%M:%S.%L',
second: '%H:%M:%S',
minute: '%H:%M',
hour: '%H:%M',
day: '%m-%d',
}
}
},
rangeSelector : {
buttons : [{
type : 'hour',
count : 1,
text : '1h'
}, {
type : 'day',
count : 1,
text : '1D'
}, {
type : 'all',
count : 1,
text : 'All'
}],
selected : 1,
inputEnabled : false
},
series : [{
name : 'AAPL',
type: 'area',
data : data,
gapSize: 5,
tooltip: {
valueDecimals: 2
},
fillColor : {
linearGradient : {
x1: 0,
y1: 0,
x2: 0,
y2: 1
},
stops : [
[0, Highcharts.getOptions().colors[0]],
[1, Highcharts.Color(Highcharts.getOptions().colors[0]).setOpacity(0).get('rgba')]
]
},
threshold: null
}]
});
});
});
xAxis: {
dateTimeLabelFormats: {
millisecond: '%H:%M:%S.%L',
second: '%H:%M:%S',
minute: '%H:%M',
hour: '%H:%M',
day: '%m-%d',
}
}
这段就是设置x轴的日期格式
日期格式可以设置为如下参数:
format: String
一个String型的格式字符串,包含如下形式
%a: 简短型星期,比如‘Mon’.
%A: 完整型星期, 比如‘Monday’.
%d: 两位的日期, 从01到31.
%e: 数字型日期,从 1 到 31.
%b: 简短型月份, 比如 ‘Jan’.
%B: 完整型月份, 比如 ‘January’.
%m: 两位的月份, 从01 到 12.
%y: 两位数的年份, 比如 09 代表 2009.
%Y: 四位数的年份, 比如 2009.
%H: 两位数的24小时制的时间, 从00 到 23.
%I: 两位输得12小时制的时间, 从 00 到 11.
%l (小写字母l):12小时制的时间, 1 到 11.
%M: 两位的分钟, 从00 到 59.
%p: 小写形式的 AM 或 PM.
%P: 大写形式的 AM or PM.
%S: 两位的秒, 从00 到 59
顶(20)
踩(0)
- 最新评论
